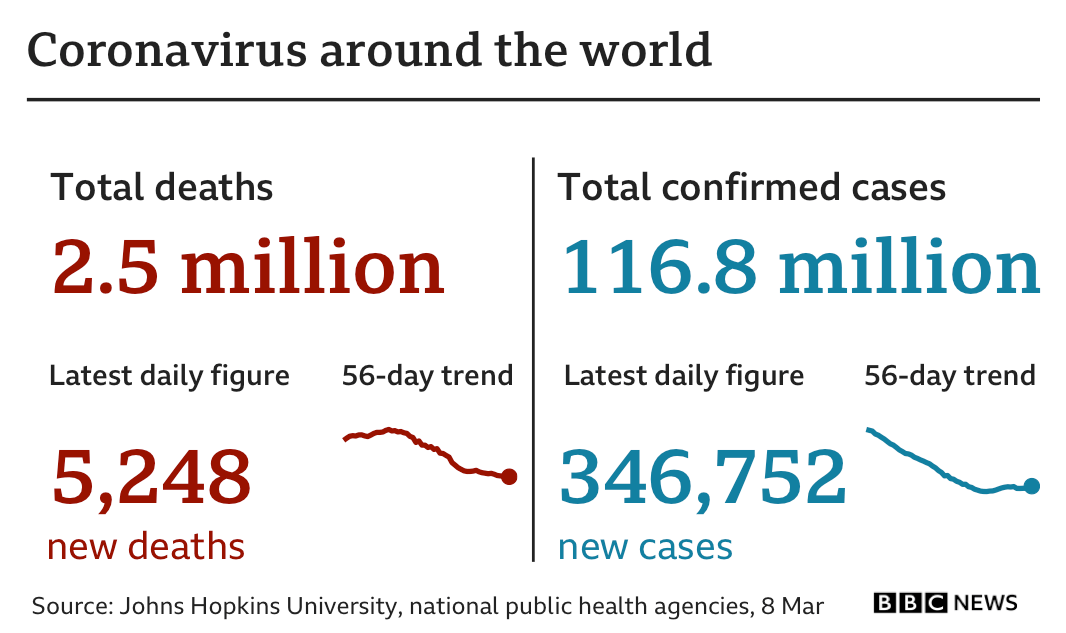
Covid-19 is continuing to spread around the world, with more than 116 million confirmed cases and 2.5 million deaths across nearly 200 countries.

The US, India and Brazil have seen the highest number of confirmed cases, followed by Russia, the UK and a number of European countries.
Very few places have been left untouched.
 mapped
Zoom to The world Africa North America Latin America & Caribbean Asia Europe Middle East Oceania Show116,879,152cases2,594,064deaths28,900,000Circles show number of confirmed coronavirus cases per country.
Source: Johns Hopkins University, national public health agencies
Figures last updated 8 March 2021, 10:39 GMT

In the table below, countries can be reordered by deaths, death rate and total cases. In the coloured bars on the right-hand side, countries in which cases have risen to more than 10,000 per day are those with black bars on the relevant date.
 data in detail
Scroll table to see more data
*Deaths per 100,000 peopleFilter: The world Africa North America Latin America & Caribbean Asia Europe Middle East Oceania
| Country | Deaths | Death rate* | Total Cases | New Cases0101001k10k** |
|---|---|---|---|---|
| US | 522,818 | 159.8 | 28,887,473 | 25 JAN04 MAR |
| Brazil | 265,411 | 126.7 | 11,019,344 | |
| Mexico | 190,604 | 151.0 | 2,128,600 | |
| India | 157,853 | 11.7 | 11,229,398 | |
| UK | 124,501 | 185.4 | 4,218,520 | |
| Italy | 99,785 | 164.6 | 3,067,486 | |
| France | 88,574 | 136.3 | 3,904,233 | |
| Russia | 87,985 | 60.4 | 4,284,408 | |
| Germany | 71,989 | 86.6 | 2,509,619 | |
| Spain | 71,138 | 152.4 | 3,149,012 | |
| Iran | 60,687 | 74.2 | 1,689,692 | |
| Colombia | 60,503 | 121.8 | 2,276,656 | |
| Argentina | 52,880 | 119.2 | 2,149,636 | |
| South Africa | 50,678 | 87.7 | 1,521,068 | |
| Peru | 47,681 | 149.1 | 1,364,964 | |
| Poland | 45,285 | 119.4 | 1,794,914 | |
| Indonesia | 37,266 | 13.9 | 1,379,662 | |
| Turkey | 29,030 | 35.3 | 2,780,417 | |
| Ukraine | 28,616 | 64.7 | 1,455,421 | |
| Belgium | 22,261 | 193.9 | 787,891 | |
| Canada | 22,234 | 60.0 | 892,199 | |
| Czech Republic | 21,882 | 205.2 | 1,325,291 | |
| Chile | 21,077 | 112.5 | 855,785 | |
| Romania | 20,900 | 107.1 | 828,283 | |
| Portugal | 16,540 | 161.3 | 810,094 | |
| Ecuador | 16,039 | 93.9 | 294,503 | |
| Hungary | 15,873 | 163.5 | 466,017 | |
| Netherlands | 15,836 | 92.8 | 1,120,271 | |
| Iraq | 13,572 | 35.3 | 726,548 | |
| Pakistan | 13,227 | 6.2 | 592,100 | |
| Sweden | 13,003 | 130.4 | 684,961 | |
| Philippines | 12,521 | 11.7 | 597,763 | |
| Bolivia | 11,823 | 104.1 | 254,273 | |
| Egypt | 10,995 | 11.2 | 186,503 | |
| Bulgaria | 10,614 | 150.5 | 260,308 | |
| Switzerland | 10,048 | 117.9 | 562,290 | |
| Austria | 8,713 | 98.0 | 475,070 | |
| Morocco | 8,682 | 24.1 | 486,223 | |
| Bangladesh | 8,462 | 5.2 | 550,330 | |
| Japan | 8,280 | 6.5 | 439,860 | |
| Tunisia | 8,201 | 70.9 | 237,704 | |
| Slovakia | 7,921 | 145.3 | 323,786 | |
| Greece | 6,758 | 64.2 | 205,120 | |
| Saudi Arabia | 6,528 | 19.4 | 379,831 | |
| Guatemala | 6,473 | 37.5 | 178,560 | |
| Panama | 5,923 | 141.8 | 344,834 | |
| Israel | 5,899 | 70.4 | 803,260 | |
| Croatia | 5,590 | 134.5 | 246,514 | |
| Bosnia and Herzegovina | 5,228 | 157.3 | 135,513 | |
| Lebanon | 5,046 | 73.6 | 395,604 | |
| Jordan | 4,935 | 49.5 | 427,717 | |
| China | 4,838 | 0.3 | 101,132 | |
| Serbia | 4,562 | 65.3 | 485,439 | |
| Ireland | 4,422 | 91.8 | 223,219 | |
| Honduras | 4,260 | 44.4 | 173,729 | |
| Moldova | 4,111 | 101.5 | 195,252 | |
| Slovenia | 3,891 | 187.3 | 195,468 | |
| Georgia | 3,591 | 89.7 | 272,998 | |
| Lithuania | 3,336 | 119.1 | 202,430 | |
| Paraguay | 3,318 | 47.7 | 168,043 | |
| Azerbaijan | 3,241 | 32.6 | 236,768 | |
| Armenia | 3,225 | 109.3 | 175,016 | |
| Myanmar | 3,200 | 6.0 | 142,034 | |
| North Macedonia | 3,195 | 153.4 | 107,163 | |
| Kazakhstan | 3,184 | 17.4 | 268,327 | |
| Dominican Republic | 3,172 | 29.8 | 243,247 | |
| Algeria | 3,013 | 7.1 | 114,234 | |
| Nepal | 3,010 | 10.7 | 274,721 | |
| Costa Rica | 2,833 | 56.7 | 206,640 | |
| Afghanistan | 2,449 | 6.6 | 55,847 | |
| Ethiopia | 2,429 | 2.2 | 166,138 | |
| Denmark | 2,379 | 41.4 | 214,839 | |
| Libya | 2,273 | 34.0 | 138,640 | |
| Palestinian Territories | 2,140 | 44.0 | 196,812 | |
| Belarus | 2,038 | 21.6 | 295,511 | |
| Nigeria | 1,969 | 1.0 | 158,506 | |
| Albania | 1,939 | 67.3 | 112,897 | |
| El Salvador | 1,915 | 29.8 | 60,800 | |
| Sudan | 1,895 | 4.5 | 30,540 | |
| Kenya | 1,876 | 3.7 | 108,827 | |
| Latvia | 1,695 | 87.9 | 90,331 | |
| Kosovo | 1,649 | 89.4 | 73,148 | |
| South Korea | 1,642 | 3.2 | 92,817 | |
| Oman | 1,591 | 32.9 | 143,955 | |
| Zimbabwe | 1,485 | 10.3 | 36,271 | |
| Kyrgyzstan | 1,473 | 23.4 | 86,583 | |
| Venezuela | 1,384 | 4.8 | 142,338 | |
| United Arab Emirates | 1,322 | 13.7 | 410,849 | |
| Malaysia | 1,169 | 3.7 | 313,460 | |
| Kuwait | 1,127 | 27.2 | 200,572 | |
| Zambia | 1,124 | 6.5 | 82,421 | |
| Malawi | 1,069 | 5.9 | 32,442 | |
| Montenegro | 1,067 | 170.0 | 79,774 | |
| Syria | 1,063 | 6.3 | 15,981 | |
| Senegal | 919 | 5.8 | 35,857 | |
| Australia | 909 | 3.7 | 29,046 | |
| Finland | 767 | 13.9 | 62,063 | |
| DR Congo | 712 | 0.8 | 26,541 | |
| Mozambique | 693 | 2.3 | 62,520 | |
| Estonia | 667 | 50.4 | 76,183 | |
| Eswatini | 658 | 57.9 | 17,184 | |
| Luxembourg | 652 | 107.9 | 56,296 | |
| Uruguay | 651 | 18.9 | 63,837 | |
| Yemen | 651 | 2.3 | 2,473 | |
| Ghana | 647 | 2.2 | 86,465 | |
| Norway | 632 | 11.8 | 74,942 | |
| Uzbekistan | 622 | 1.9 | 80,219 | |
| Cameroon | 551 | 2.2 | 35,714 | |
| Angola | 514 | 1.7 | 21,086 | |
| Sri Lanka | 502 | 2.4 | 85,695 | |
| Bahrain | 472 | 30.1 | 126,602 | |
| Jamaica | 453 | 15.4 | 26,026 | |
| Mauritania | 442 | 10.0 | 17,322 | |
| Namibia | 438 | 17.9 | 40,030 | |
| Botswana | 359 | 15.9 | 31,746 | |
| Mali | 358 | 1.9 | 8,580 | |
| Cuba | 348 | 3.1 | 55,693 | |
| Uganda | 334 | 0.8 | 40,464 | |
| Malta | 334 | 76.0 | 24,398 | |
| Belize | 315 | 82.2 | 12,335 | |
| Lesotho | 307 | 14.6 | 10,523 | |
| Somalia | 302 | 2.0 | 8,321 | |
| Madagascar | 300 | 1.1 | 20,155 | |
| Rwanda | 268 | 2.2 | 19,551 | |
| Qatar | 262 | 9.4 | 166,949 | |
| Haiti | 251 | 2.3 | 12,536 | |
| Cyprus | 233 | 19.6 | 36,878 | |
| Ivory Coast | 202 | 0.8 | 35,187 | |
| Guyana | 201 | 25.8 | 8,807 | |
| Bahamas | 181 | 46.9 | 8,600 | |
| Niger | 177 | 0.8 | 4,822 | |
| Suriname | 175 | 30.4 | 8,977 | |
| Nicaragua | 174 | 2.7 | 6,489 | |
| Guadeloupe | 168 | 42.0 | 10,458 | |
| Cape Verde | 154 | 28.3 | 15,782 | |
| Gambia | 152 | 6.7 | 4,759 | |
| Comoros | 146 | 17.5 | 3,596 | |
| Burkina Faso | 143 | 0.7 | 12,181 | |
| French Polynesia | 140 | 50.4 | 18,459 | |
| Chad | 140 | 0.9 | 4,177 | |
| Trinidad and Tobago | 139 | 10.0 | 7,736 | |
| Congo | 131 | 2.5 | 9,179 | |
| Mayotte | 125 | 48.2 | 18,140 | |
| Andorra | 112 | 145.4 | 11,042 | |
| South Sudan | 102 | 0.9 | 8,766 | |
| Equatorial Guinea | 96 | 7.3 | 6,329 | |
| Guinea | 95 | 0.8 | 16,670 | |
| Gibraltar | 93 | 275.8 | 4,249 | |
| Togo | 92 | 1.2 | 7,570 | |
| Gabon | 90 | 4.2 | 15,625 | |
| Tajikistan | 90 | 1.0 | 13,308 | |
| French Guiana | 87 | 30.7 | 16,693 | |
| Channel Islands | 86 | 50.4 | 4,041 | |
| Thailand | 85 | 0.1 | 26,441 | |
| Liberia | 85 | 1.8 | 2,024 | |
| Sierra Leone | 79 | 1.0 | 3,920 | |
| Aruba | 77 | 72.7 | 8,110 | |
| San Marino | 76 | 225.0 | 3,922 | |
| Benin | 75 | 0.7 | 6,071 | |
| Maldives | 64 | 12.4 | 20,794 | |
| Djibouti | 63 | 6.6 | 6,146 | |
| Central African Republic | 63 | 1.4 | 5,021 | |
| Réunion | 59 | 6.7 | 13,125 | |
| Liechtenstein | 54 | 142.4 | 2,590 | |
| Guinea-Bissau | 49 | 2.6 | 3,312 | |
| Martinique | 47 | 12.5 | 6,886 | |
| Saint Lucia | 43 | 23.6 | 3,866 | |
| Barbados | 37 | 12.9 | 3,285 | |
| Vietnam | 35 | 0.0 | 2,512 | |
| Sao Tome and Principe | 32 | 15.2 | 1,950 | |
| Singapore | 29 | 0.5 | 60,046 | |
| Iceland | 29 | 8.6 | 6,059 | |
| Saint Martin | 27 | 72.5 | 2,070 | |
| New Zealand | 26 | 0.5 | 2,405 | |
| Monaco | 26 | 67.2 | 2,023 | |
| Isle of Man | 25 | 29.7 | 757 | |
| Curaçao | 22 | 13.5 | 4,807 | |
| Antigua and Barbuda | 21 | 21.8 | 848 | |
| Tanzania | 21 | 0.0 | 509 | |
| Papua New Guinea | 16 | 0.2 | 1,670 | |
| Seychelles | 15 | 15.4 | 2,979 | |
| Turks and Caicos Islands | 15 | 39.8 | 2,177 | |
| Diamond Princess cruise ship | 13 | 712 | ||
| Bermuda | 12 | 19.1 | 722 | |
| Taiwan | 10 | 0.0 | 969 | |
| Mauritius | 10 | 0.8 | 641 | |
| St Vincent and the Grenadines | 8 | 7.3 | 1,663 | |
| Eritrea | 7 | 0.2 | 2,944 | |
| Burundi | 3 | 0.0 | 2,319 | |
| Brunei | 3 | 0.7 | 189 | |
| Mongolia | 2 | 0.1 | 3,336 | |
| Cayman Islands | 2 | 3.1 | 451 | |
| Fiji | 2 | 0.2 | 63 | |
| MS Zaandam cruise ship | 2 | 9 | ||
| Bhutan | 1 | 0.1 | 868 | |
| Faroe Islands | 1 | 2.1 | 658 | |
| Saint Barthelemy | 1 | 10.2 | 638 | |
| British Virgin Islands | 1 | 3.4 | 153 | |
| Grenada | 1 | 0.9 | 148 | |
| Montserrat | 1 | 20.0 | 20 | |
| Cambodia | 0 | 0.0 | 1,011 | |
| Dominica | 0 | 0.0 | 144 | |
| Timor-Leste | 0 | 0.0 | 122 | |
| New Caledonia | 0 | 0.0 | 67 | |
| Falkland Islands | 0 | 0.0 | 54 | |
| Laos | 0 | 0.0 | 47 | |
| Saint Kitts and Nevis | 0 | 0.0 | 41 | |
| Greenland | 0 | 0.0 | 31 | |
| Vatican | 0 | 0.0 | 27 | |
| Saint Pierre and Miquelon | 0 | 0.0 | 24 | |
| Solomon Islands | 0 | 0.0 | 18 | |
| Anguilla | 0 | 0.0 | 18 | |
| Marshall Islands | 0 | 0.0 | 4 | |
| Samoa | 0 | 0.0 | 3 | |
| Vanuatu | 0 | 0.0 | 1 | |
| Micronesia | 0 | 0.0 | 1 |
Show more
This information is regularly updated but may not reflect the latest totals for each country.
** The past data for new cases is a three day rolling average. Due to revisions in the number of cases, an average cannot be calculated for this date.
Source: Johns Hopkins University, national public health agencies and UN population data
Figures last updated: 8 March 2021, 10:39 GMT
Note: The map, table and animated bar chart in this page use a different source for figures for France and the UK from that used by Johns Hopkins University, which results in a slightly lower overall total. US figures do not include Puerto Rico, Guam or the US Virgin Islands.

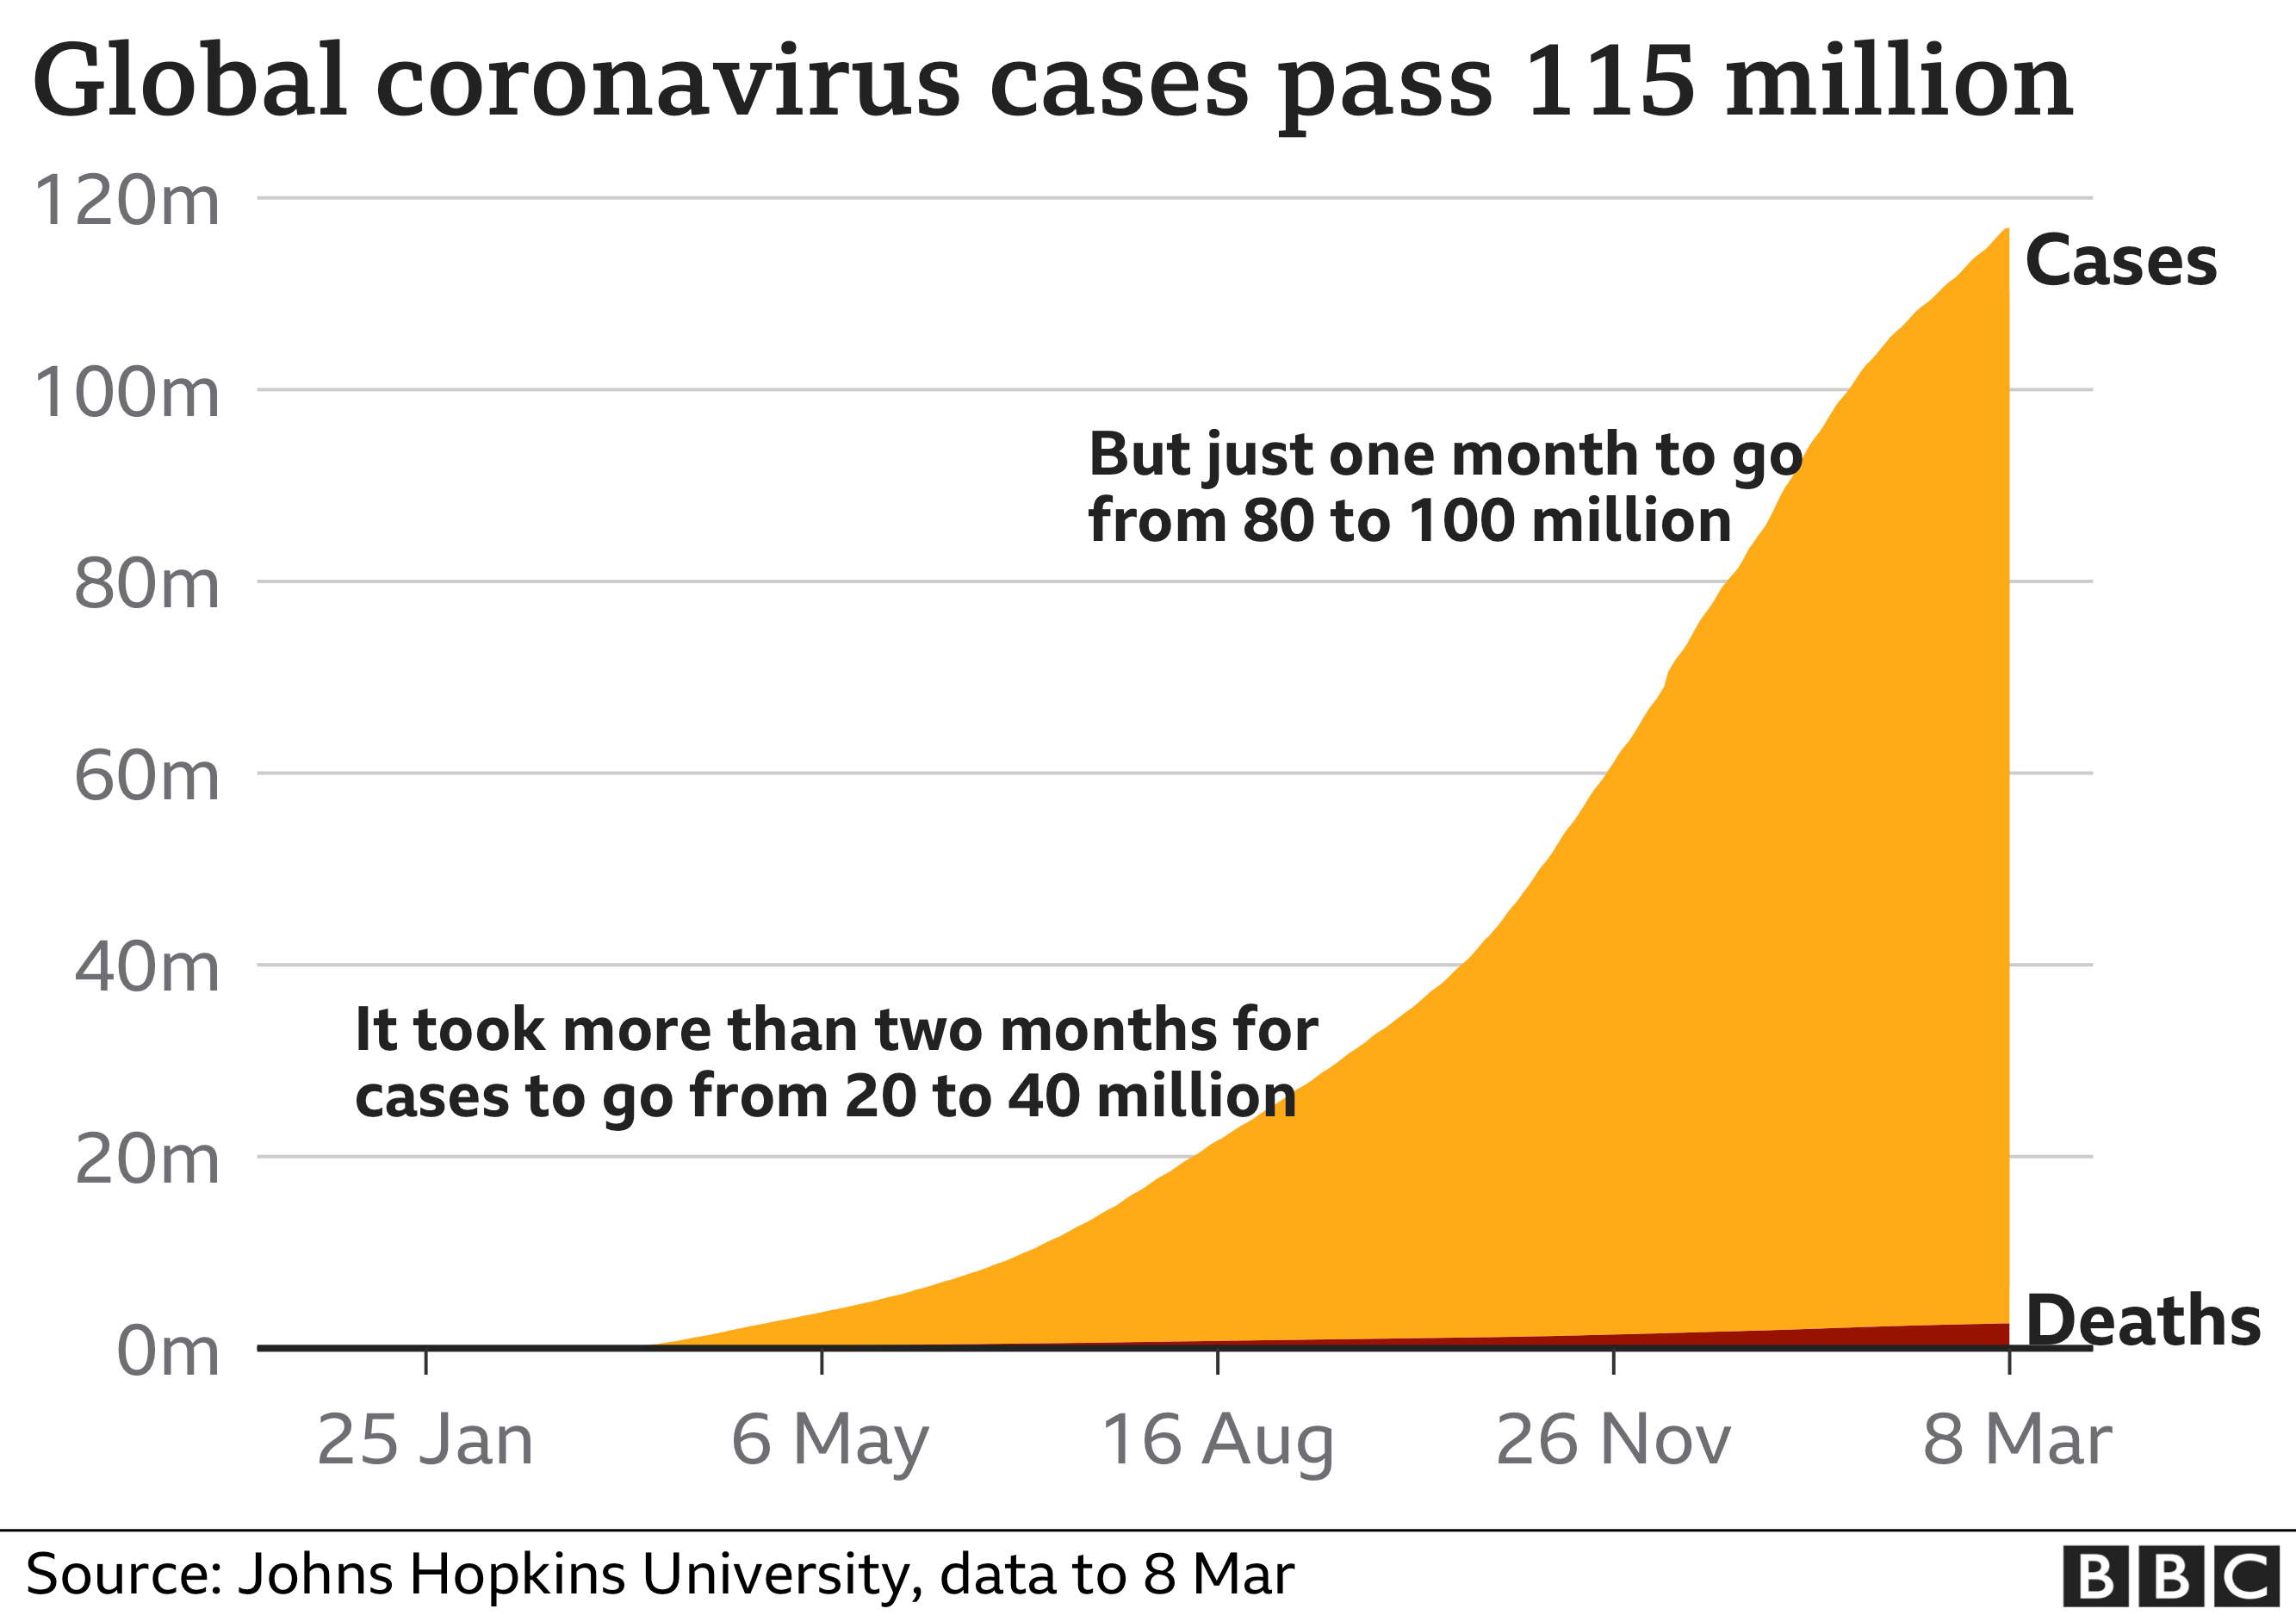
Confirmed cases have been rising steeply since the middle of last year, but the true extent of the first outbreaks in 2020 is unclear because testing was not then widely available.
The 100 millionth coronavirus case was recorded at the end of January – about a year after the first officially diagnosed case of the virus.

Deaths have also been rising, however official figures may not fully reflect the true number in many countries.
Data on excess deaths, a measure of how many more people are dying than would be expected based on the previous few years, may give a better indication of the actual numbers in many cases.

Who has vaccinated the most?
Several coronavirus vaccines against the virus have now been approved for use, either by individual countries or groups of countries, such as the European Union and the World Health Organization (WHO).
Of the 114 countries and territories administering vaccines and publishing rollout data, 60 are high-income nations, 53 are middle-income and one low-income.
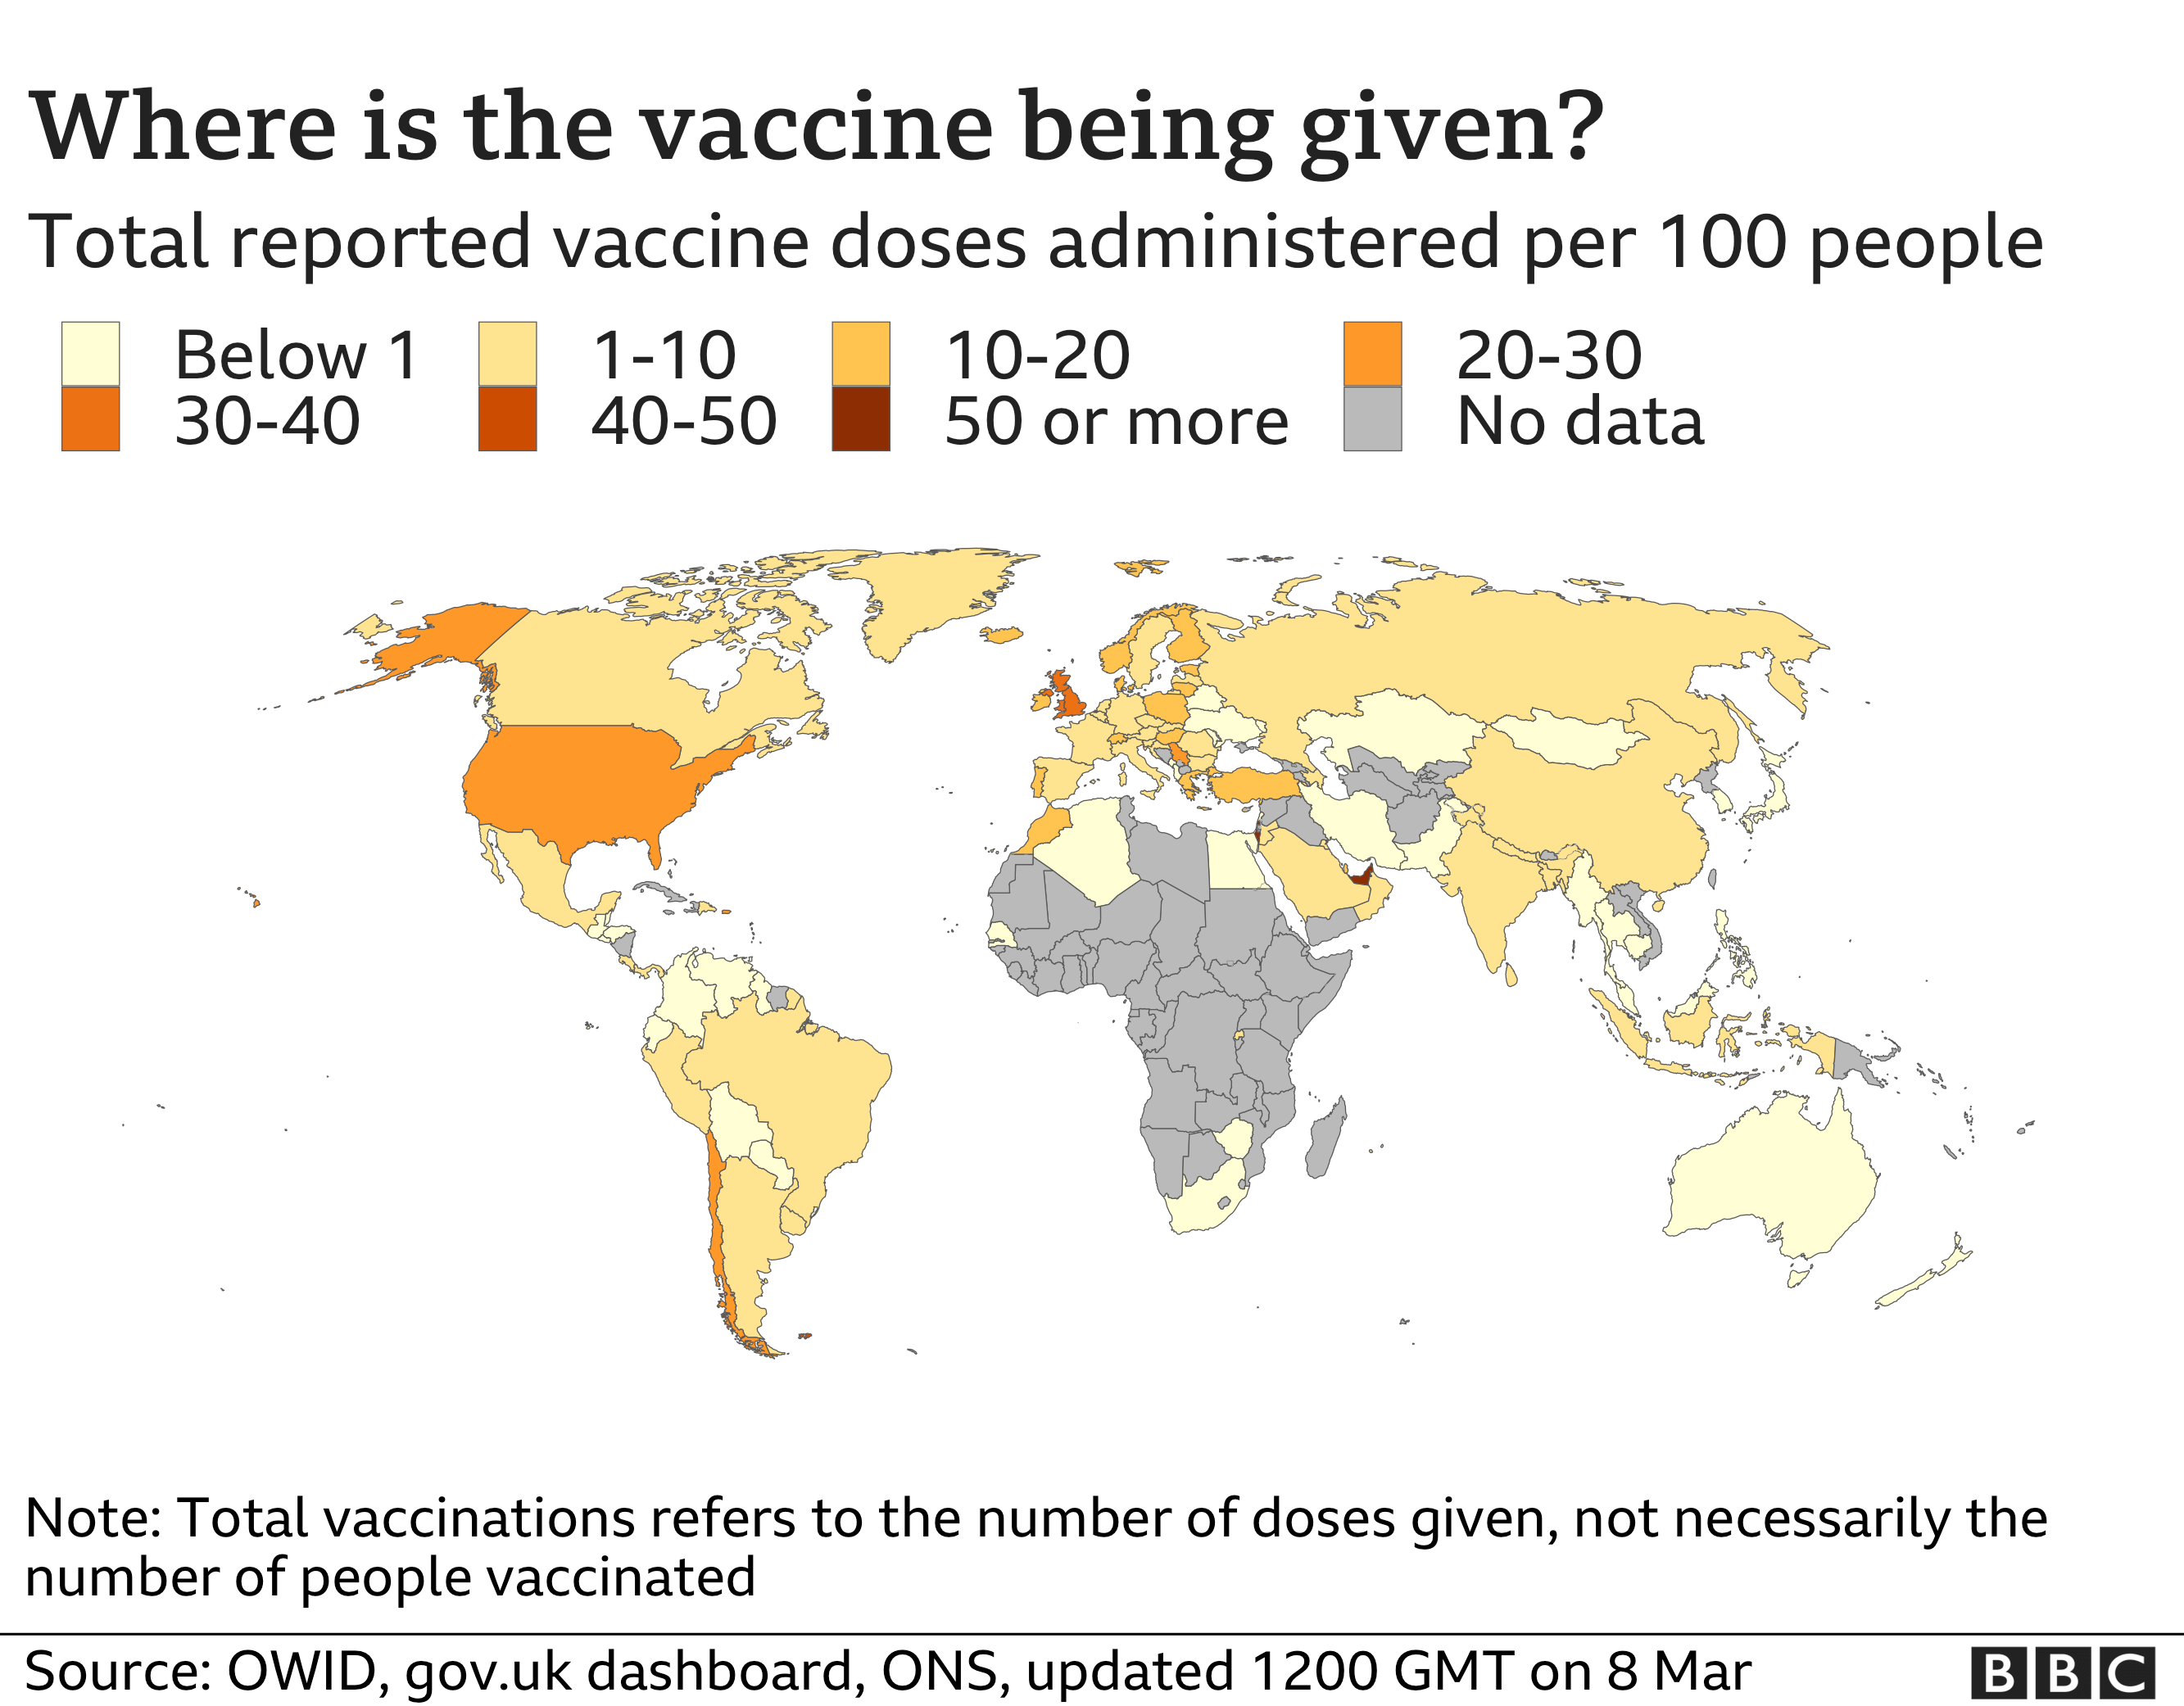
The map below, using figures collated by Our World in Data – a collaboration between Oxford University and an educational charity – shows the total number of doses given per 100 people, mostly first doses.

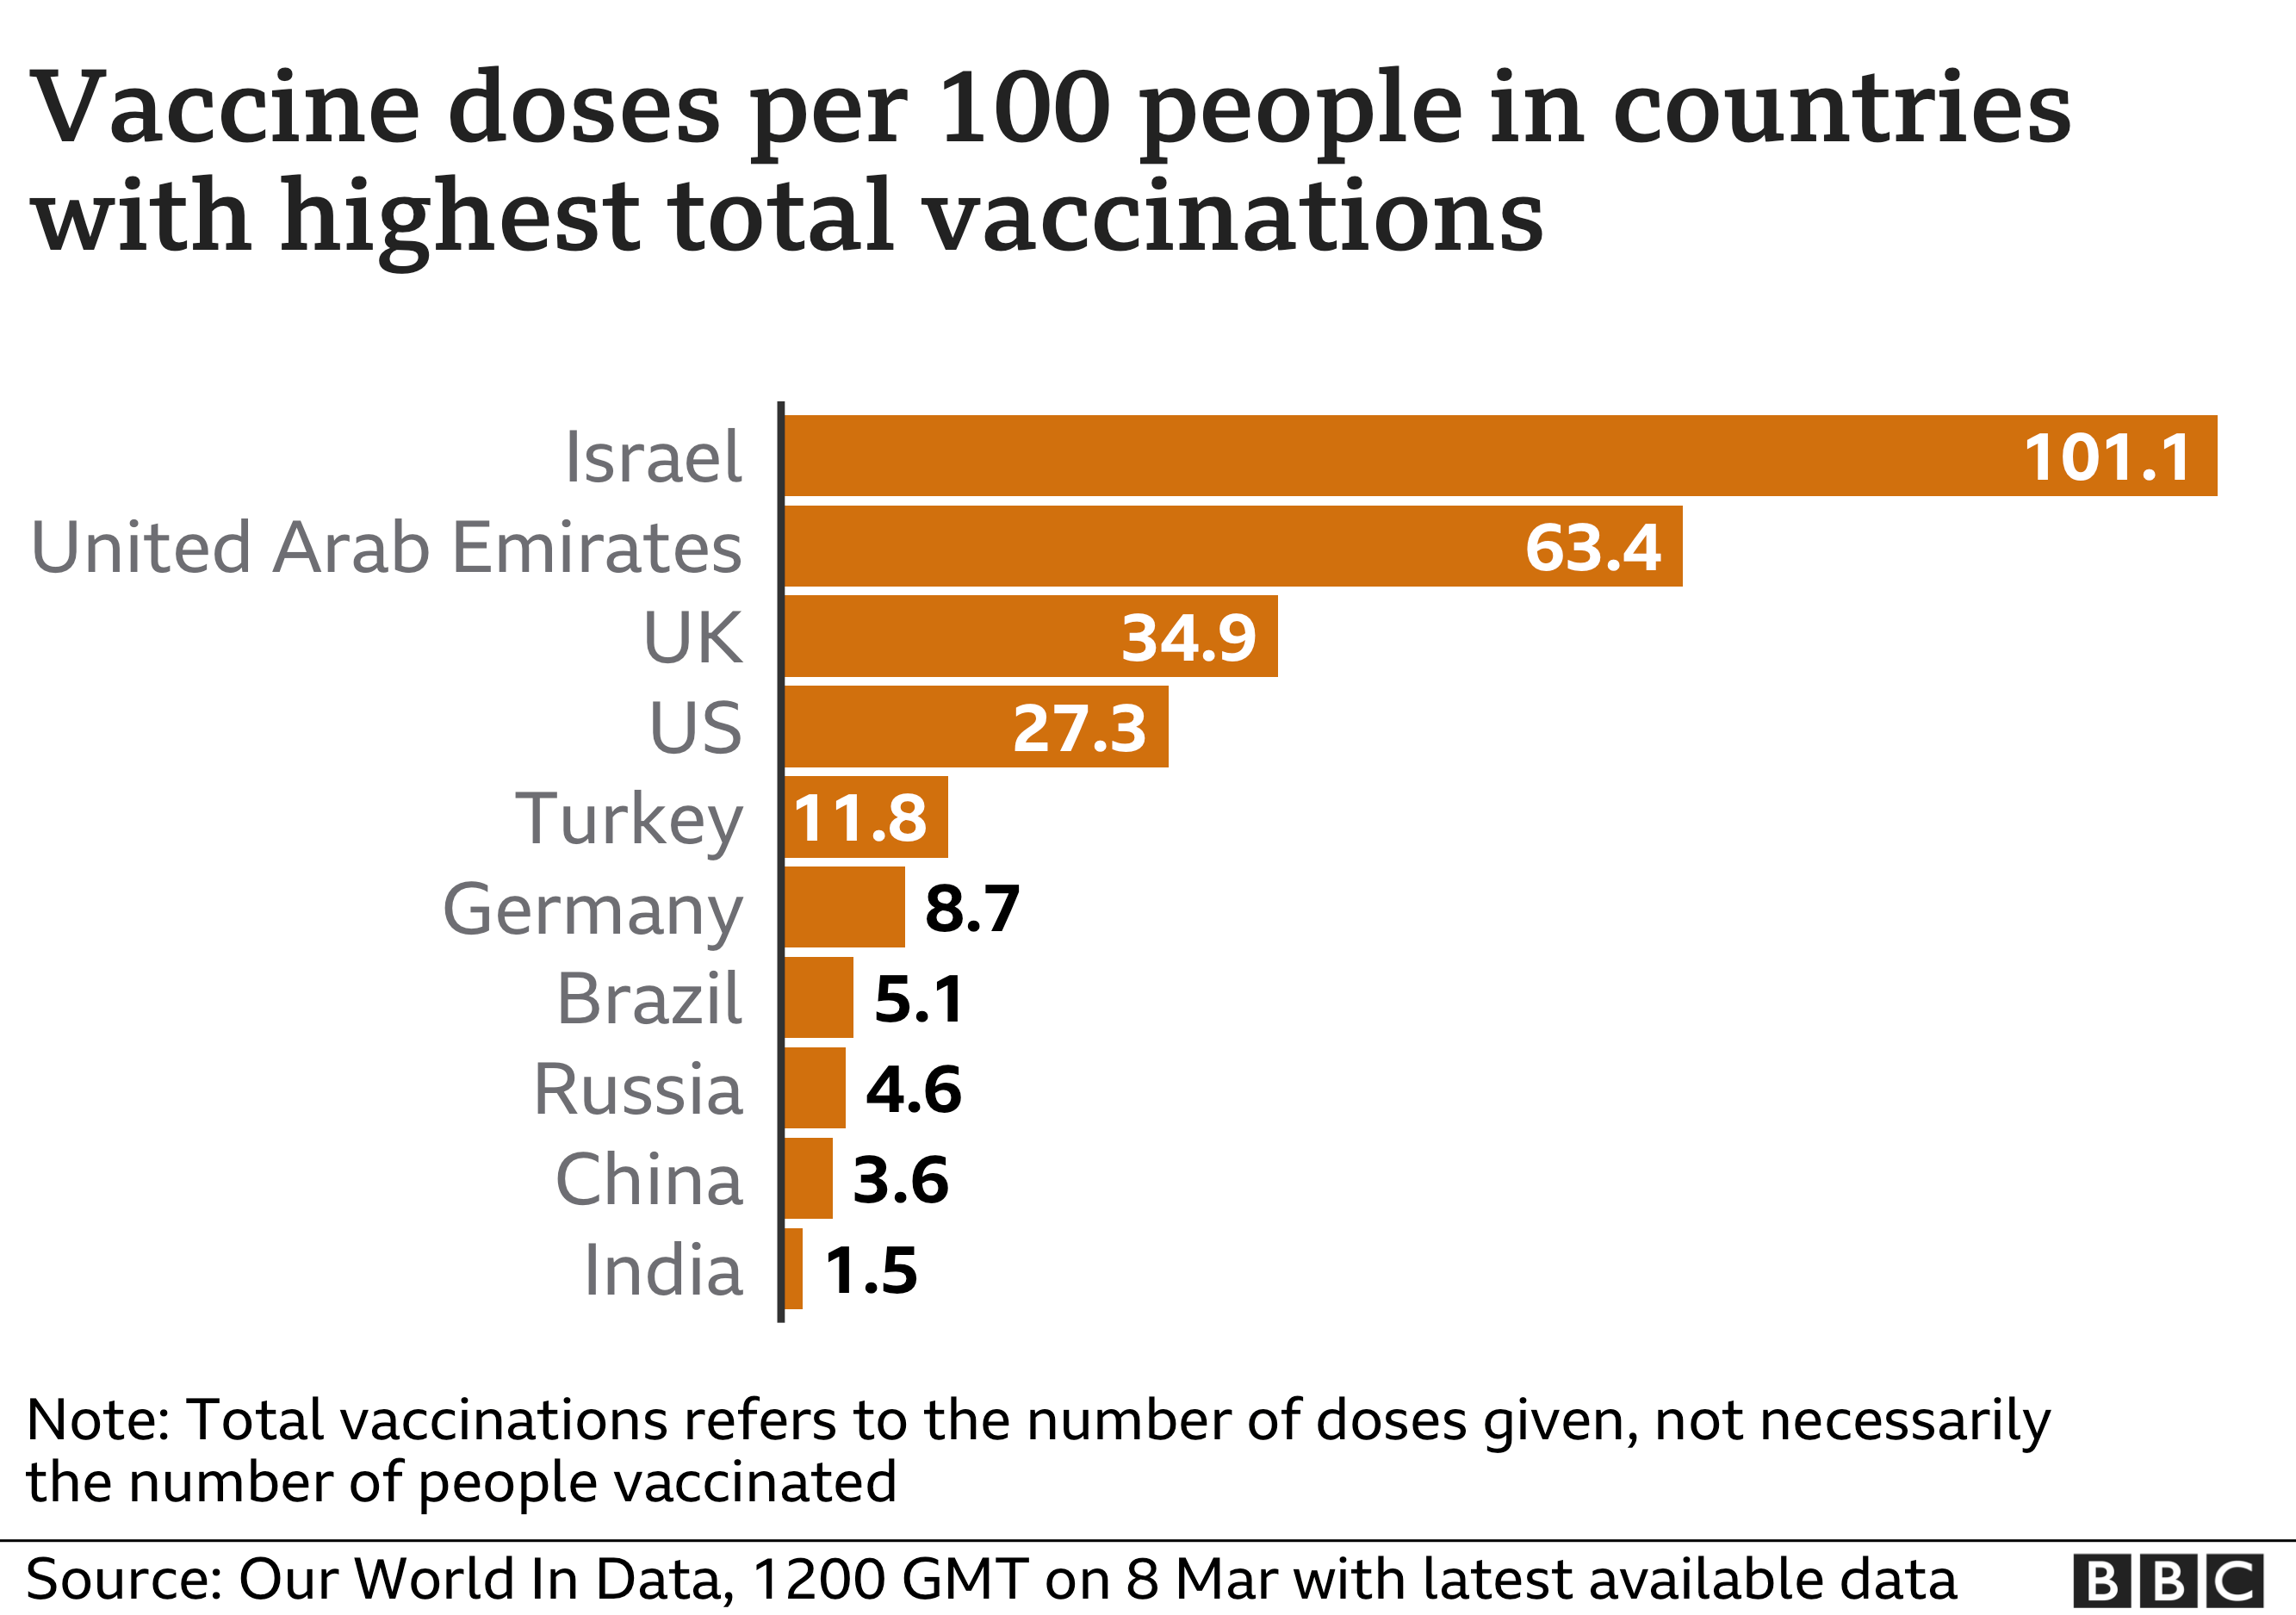
Overall, the US and China have given the most doses, 87 million and 52 million respectively, while the UK has administered more than 22 million so far.
But when breaking the figures down by population, looking at doses administered per 100 people in the 10 countries giving the most vaccinations, Israel, the UAE and the UK top the list – as the chart below shows.

Most countries are prioritising the over-60s, health workers and people who are clinically vulnerable.
Some countries have secured more vaccine doses than their populations need, while other lower-income countries are relying on a global plan known as Covax, which is seeking to ensure everyone in the world has access to a vaccine.
Several African countries have received vaccines through the Covax initiative, with vaccinations now underway in Ghana, Ivory Coast, Nigeria, Kenya and Rwanda, among others.
Source: https://www.bbc.com/news/world-51235105


